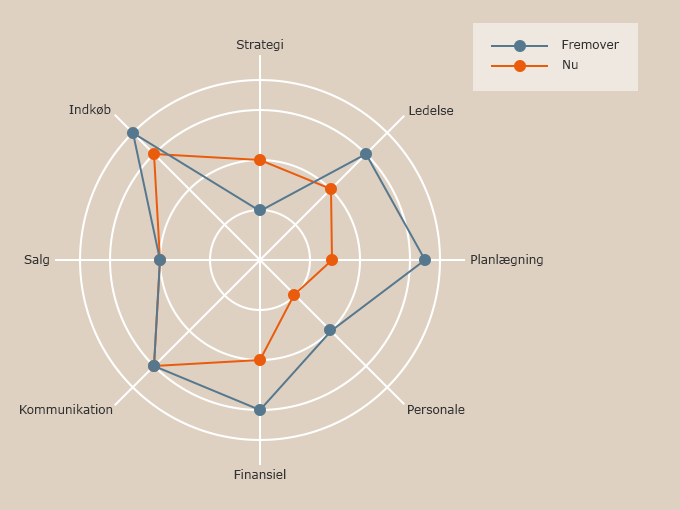
A radar map is an effective method for comparing multiple variables based on different characteristics. The method can e.g. used to compare different cars' petrol consumption, manoeuvrability, acceleration ability and engine power.
Radar maps (also called cobwebs and star maps) are used within:

A radar map is a graphical representation of the size or distance between 5 to 10 units. The map is a two-dimensional map and consists of three or more quantitative variables, which are represented on axes that start from the same point.
Each "arm" in the map represents a variable. Each variable is assessed on a scale from e.g. 0-5. The results are inserted into the radar map, with the smallest value in the middle. A line connects each of the data values, making the map look like a spider web or a star.
Fill out the form to book a 30-60 minute session.
We will respond within 24 hours
Contact us today and hear about your options